New demand for office space fell just 1.5 percent nationally from March to April, a departure from the seasonal norm that typically sees an increase in demand during the month of April. In fact, demand for office space now sits at two-thirds of normal, according to the VTS Office Demand Index (VODI).
While underperforming nationally in April compared to the average increase seen in April pre-pandemic, new demand for office space is still up 12.1 percent quarter-over-quarter. With that being said, the VODI is down year-over-year, primarily due to an abnormal surge in pent-up demand in April 202. This surge in demand can be attributed to the post-vaccine push to implement office plans that had been on hold during earlier phases of the pandemic.
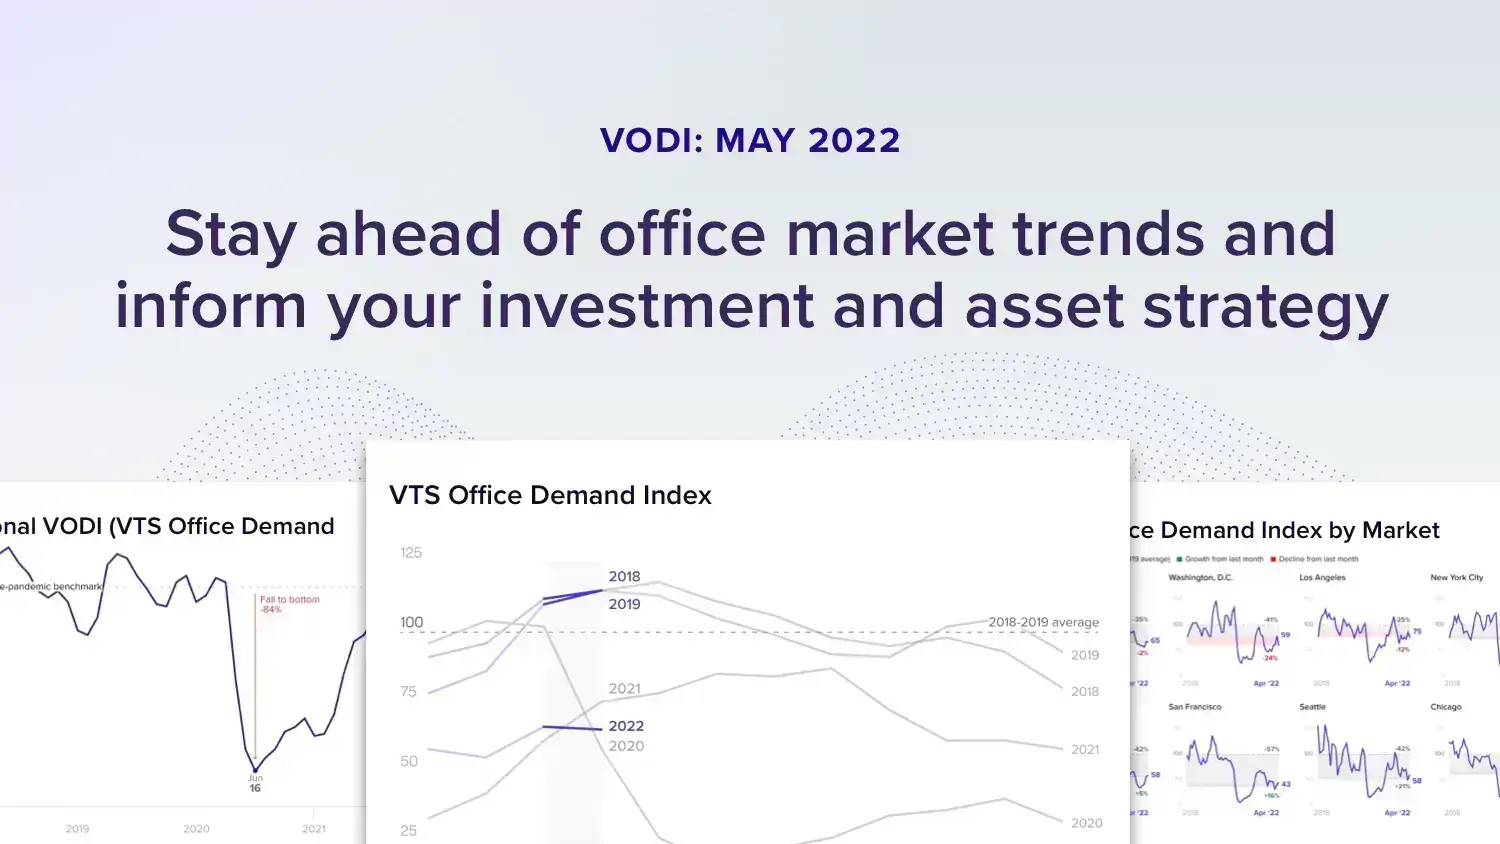
What is the VTS Office Demand Index (VODI)?
The VODI is the earliest available indicator of forthcoming office real estate trends, locally and nationally, and represents up to 99% of new demand for office space in seven major markets, including New York City, Washington DC, Los Angeles, Chicago, Boston, Seattle, and San Francisco. The VODI tracks tenant tours, both in-person and virtual, of office properties across the nation, and is the only commercial real estate index to track tenant demand.
The VTS Office Demand Index is powered by proprietary VTS Data, composed of aggregated and anonymized commercial real estate data from the 12B+ square feet of assets managed on the VTS platform.
Get today’s commercial real estate market trends in the latest VODI report:
- How long is office demand projected to be down year-over-year, and why?
- How is the labour market — and job posting growth specifically — impacting new office demand in April?
- Why cities whose occupational mix is more amenable to remote work have seen persistently lower demand for office space.
Download the full VTS Office Demand Index April 2022 report now for in-depth insights into demand recovery and detailed methodology.
Want to learn how to use the data in the VODI? The VTS Office Demand Index is just a sliver of the insights available to you. VTS Data is your competitive edge in today’s market. Learn how to reinvent your investment strategy using active anonymized data from the $200B in leasing transactions. Benchmark your performance against the market and stay competitive in an ever-changing industry. Using data only available on VTS, resolve questions about supply and demand, leasing efficiency, and tenant exposure to unlock – and unblock – deals. Learn more about VTS Data here.
Eager to learn more about how the pandemic has and will continue to impact long-term market dynamics of the office sector, especially as many companies continue to adopt hybrid and work-from-home models? Read our latest VTS Green Shoots Report here.
Read the official May VODI press release here.