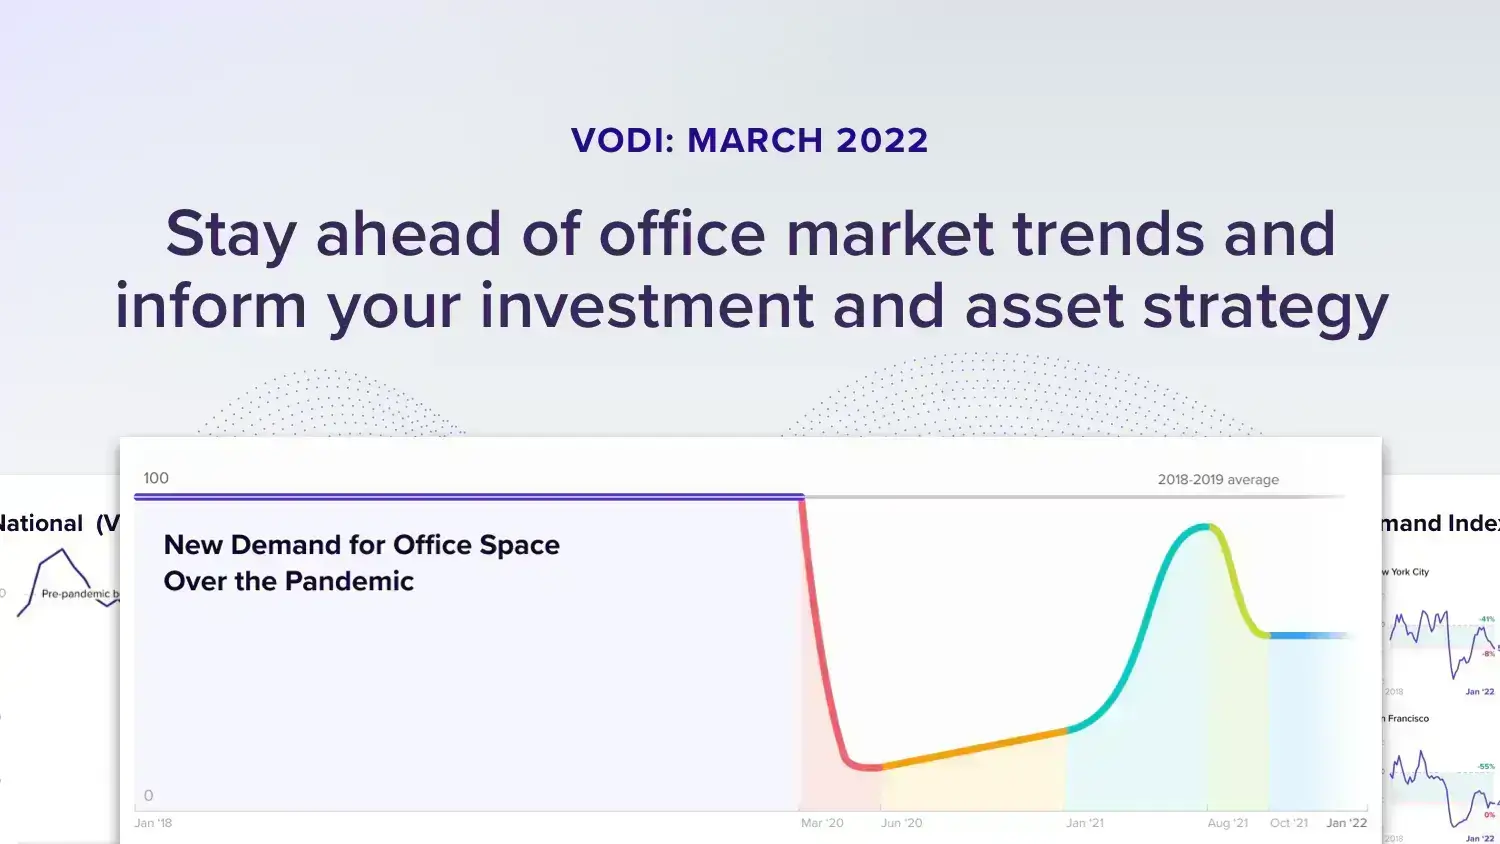
Demand for office space is down by 47.1 percent compared to February of 2020, the last month prior to the declaration of the pandemic, according to the latest VTS Office Demand Index (VODI).
While new demand for office space declined modestly in February, marking the fourth consecutive month of little to no monthly change, cumulatively the national VODI is down 9.8 percent over the same period.
Currently at a VODI of 55, demand for office space is down 5.2 percent month-over-month and down 9.8 percent quarter-over-quarter, but is up 31 percent year-over-year. (A VODI of 100 is a benchmark for pre-pandemic normal).
What is the VTS Office Demand Index (VODI)?
The VODI is the earliest available indicator of forthcoming office real estate trends, locally and nationally, and represents up to 99% of new demand for office space in seven major markets, including New York City, Washington DC, Los Angeles, Chicago, Boston, Seattle, and San Francisco. The VODI tracks tenant tours, both in-person and virtual, of office properties across the nation, and is the only commercial real estate index to track tenant demand.
The VTS Office Demand Index is powered by proprietary VTS Data, composed of aggregated and anonymized commercial real estate data from the 12B+ square feet of assets managed on the VTS platform.
Get today’s commercial real estate market trends in the latest VODI report:
- Which three markets have made the best pandemic recovery thus far?
- Why has this February seen the VODI fall, even though it has typically risen in February in recent pre-pandemic years?
- Which two markets saw the most significant declines this month?
- Which market is the only core market to fully erase the traction made over the past year?
Download the full VTS Office Demand Index March 2022 report now for in-depth insights into demand recovery and detailed methodology.
Want more? The VTS Office Demand Index is just a sliver of the insights available in VTS Data. VTS Data is the industry's only forward-looking market data powered by the $200B in leasing transactions managed on the VTS platform. Our latest infographic — From Positioning to Pricing: Repositioning a Vacancy — shows just one of the many ways you can put this market data to work. You can also learn more about the full VTS Data offering on our all-new resource page.
You can read our official announcement here.